
The use of ‘hours per patient day’ (HPPD) plus planned unavailability (‘headroom’) for staff resource budgeting is almost ubiquitous. This approach can be found in many countries, including Australia (Government of Western Australia, Department of Health, 2020), the Republic of Ireland (University College Cork, 2018), Malaysia (Drake, 2013), the USA (Fike and Smith-Stoner, 2016) and the UK (NHS England and NHS Improvement, 2019a). HPPD is a long-established, easy-to-use metric for determining unit budgets and comparing staff resourcing across organisations (Kirby, 2015). It is a measure of direct hours per patient day; however, in a 24/7 care environment there are indirect staff costs (annual leave, sickness, study leave, parental leave and non-clinical work) that must be included when calculating the staffing budget for a unit. In the budgetary process, these indirect costs, often called ‘unavailability’, are offset using a ‘headroom’ allowance (Hunt, 2018). It is crucial that this allowance is ‘realistic’ (NHS England and NHS Improvement, 2019b:12).
The transparency provided by e-rostering systems has enabled unavailability to be examined in greater detail (Drake, 2014a), allowing many institutions to define a single, hospital-wide, headroom figure as a key performance indicator (KPI) within their roster policies. However, evidence suggests that headroom can vary by more than 10% from unit to unit within the same hospital (Drake, 2013). Using data from e-rostering systems and those published within hospital roster policies this research explores the components of unavailability and contrasts the use of headroom in calculating unit establishments with its deployment as a management KPI.
Background
The long-standing global shortage of nurses has been widely reported (International Council of Nurses (ICN), 2006; 2019). Clearly, the effective use of existing staff is imperative. The objective of workforce scheduling (rostering) is to ensure that hospital units have the appropriate staff available to meet the clinical needs of their patients. However, staff rosters, typically published 4–8 weeks before they are worked, are based on a forecast level of patient demand contained within a ‘demand template’ (Drake, 2018). As McIntyre (2016: 9) noted, demand templates, ‘essentially determine the amount of staff, of a particular type, needed on each shift on each day’.
‘Establishment’ is the defined level of staffing for a ward, unit or hospital to deliver a specified level of care (Hurst, 2003; NHS Improvement, 2018). It is calculated using the unit ‘demand’ (the number of staff required to deliver the requisite HPPD, excluding staff unavailability) plus a planned ‘headroom’ allowance to cover staff unavailability. Headroom, also referred to as ‘uplift’, ‘downtime’, ‘time-out’ or ‘non-productive time’ (Hurst, 2003; Drake, 2014b; McIntyre, 2016; NHS Improvement, 2018), is ‘a budgeted allowance to cover annual leave, sickness, study leave, non-clinical working days and parenting’ (NHS England and NHS Improvement, 2019b:12). Both establishment and demand are quoted in whole-time equivalent (WTE) or full-time equivalent (FTE). To differentiate between the planned allowance for staff absence and the recorded absence, captured during the working of the roster, the terms ‘headroom’ and ‘unavailability’ will be used respectively.
The components of headroom
Given the importance of headroom in ensuring safe staffing levels, it is imperative that the allowance is ‘realistic’ (Kirby, 2015; NHS England and NHS Improvement, 2019b:12). However, headroom is increasingly being included in hospital roster policies as a performance measure to be reviewed monthly (NHS England and NHS Improvement, 2019b). The headroom allowance comprises:
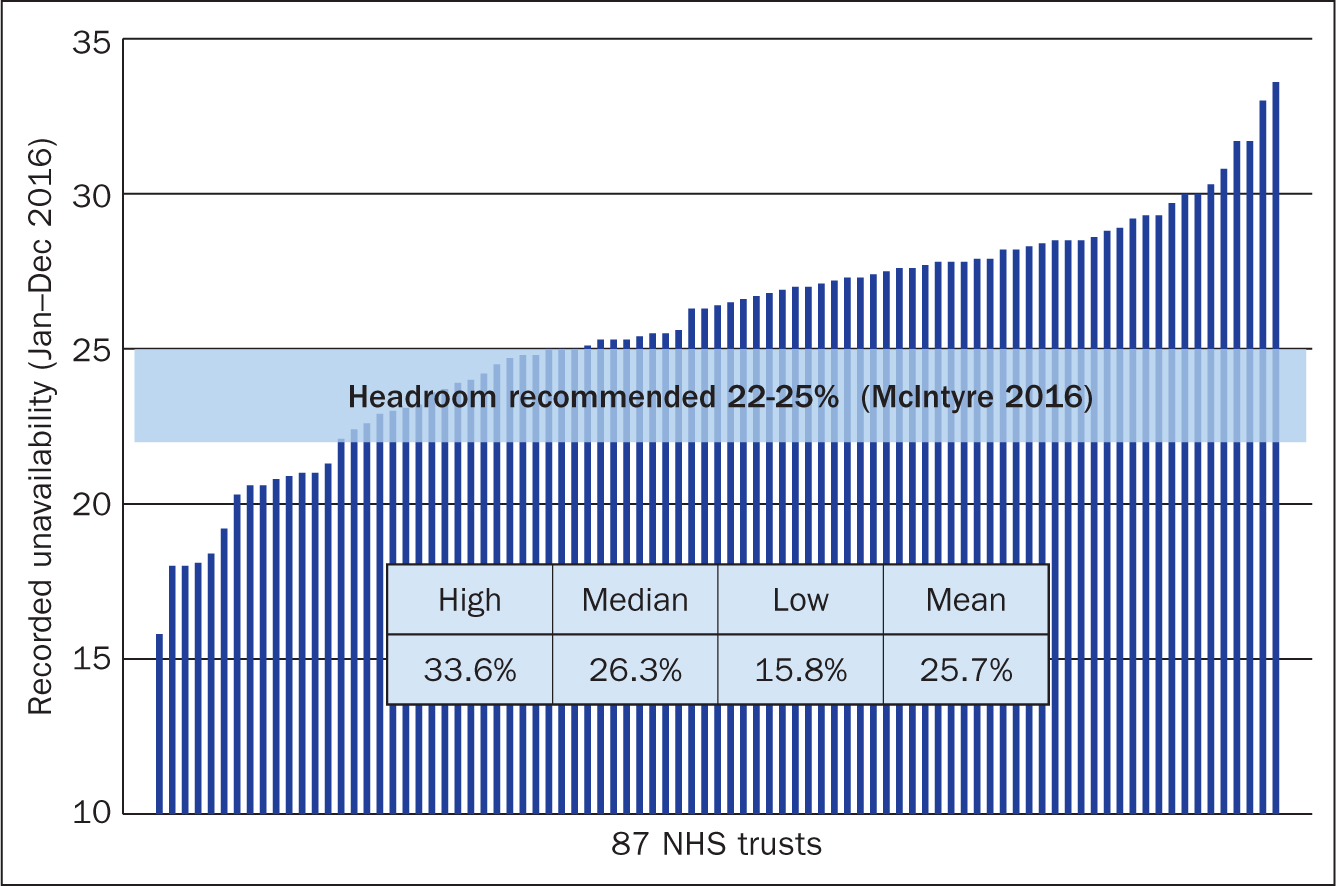
In England, NHS Improvement (2018) proposed a figure of 22.2% for headroom. This is comparable with the earlier recommendation of 22% (Hurst, 2003) and the broader range of 22-25% given by McIntyre (2016). However, in practice, the Carter report, based on an investigation of 32 NHS trusts, found a range of headroom allowances from 18.5% to 27% (Carter, 2016: 21). Disparities of this magnitude are disturbing. Although over-statement of headroom may prove costly, this can often be resolved by judicious staff redeployment. However, understated headroom results in under-stated unit budgets (McIntyre, 2016). This has implications for patient care, staff workload, staff wellbeing, staff retention and, indirectly, cost, due to the use of additional bank and agency staff.
Aims
Using e-rostering, the aim of the study was to investigate disparities between planned unavailability (‘headroom’) and recorded unavailability and to explore variations in the components of headroom: annual leave, sickness, study leave etc.
Study design
Using both quantitative and qualitative data, this study compared data from the e-rostering systems of hospitals and publicly available roster policies to examine the relationship between actual staff unavailability and ‘headroom’ allowance.
Sample
Two sources of data were used. First, data extracted from the e-rostering systems of 87 NHS trusts of various sizes for the period 1 January 2016 to 31 December 2016. This convenience sample represents approximately 37% of NHS trusts. The sample included a variety of trust ‘types’ (foundation (53), acute (46), community (44), mental health (30)) and sizes (<1000 beds (34), 1000–2999 (45), 3000–5000 (7), >5000 (1)).
The second data source was a series of 35 publicly available roster policies, collected between 2015 and 2017 as part of a separate study. This convenience sample represents approximately 19% of NHS trusts.
Data collection
Collecting planned headroom and recorded unavailability data from the e-rostering system
Each of the trusts studied employed the same brand of e-rostering system. For each of the trusts, the annual data for staff unavailability were extracted from the e-rostering system, along with the planned headroom data, into a Microsoft Excel file for analysis. The original sample included 100 trusts. However, 13 contained no data on target headroom or unavailability and were subsequently removed from the sample.
Collecting roster policy data
Using the Google search engine, data were originally collected during the period August 2015 to March 2017, using the search terms in Table 1. These results were then screened to remove duplicate/older versions of policies and irrelevant documents such as agendas, minutes and newsletters in which roster polices were mentioned. The resulting list of 46 roster policies was then revisited in October 2018 to capture any changes or updates. The policies were evaluated using Nvivo 11.4.3, a qualitative data analysis software package, for reference to ‘headroom’, ‘uplift’, downtime’, ‘unavailability’, ‘time-out’ or ‘non-productive time’. This screening produced 35 policies that were subsequently analysed for references to the components of headroom (Table 2).
| Search term | Hits |
|---|---|
| “rostering policy” site:nhs.uk filetype:pdf | 614 |
| “roster policy” site:nhs.uk filetype:pdf | 337 |
| nurse “rostering policy” -site:nhs.uk filetype:pdf | 269 |
| nurse “roster policy” -site:nhs.uk filetype:pdf | 179 |
| “rostering policy” site:nhs.uk filetype:doc | 15 |
| nurse “rostering policy” -site:nhs.uk filetype:doc | 9 |
| nurse “roster policy” -site:nhs.uk filetype:doc | 4 |
| “roster policy” site:nhs.uk filetype:doc | 3 |
| “rostering policy” site:nhs.uk filetype:docx | 3 |
| nurse “rostering policy” -site:nhs.uk filetype:docx | 3 |
| nurse “roster policy” -site:nhs.uk filetype:docx | 2 |
| “roster policy” site:nhs.uk filetype:docx | 1 |
| Trust | Last accessed |
|---|---|
| Aintree University Hospital NHS Foundation Trust | 30/08/2016 |
| Avon and Wiltshire Mental Health Partnership NHS Trust | 29/04/2019 |
| Barnet, Enfield and Haringey Mental Health NHS Trust | 23/08/2016 |
| Blackpool Teaching Hospitals NHS Foundation Trust | 03/10/2018 |
| Bolton NHS Foundation Trust | 03/10/2018 |
| Cheshire and Wirral Partnership NHS Foundation Trust | 03/10/2018 |
| Cumbria Partnership NHS Foundation Trust | 03/10/2018 |
| Doncaster and Bassetlaw Hospitals NHS Foundation Trust | 29/04/2019 |
| East Kent Hospitals University NHS Foundation Trust | 30/08/2016 |
| Gloucestershire Hospitals NHS Foundation Trust | 12/03/2017 |
| Hampshire Community Health Care | 12/03/2017 |
| Isle of Wight NHS Trust | 29/04/2019 |
| Leicestershire Partnership NHS Trust | 03/10/2018 |
| Mersey Care NHS Trust | 29/04/2019 |
| NHS Borders | 03/10/2018 |
| NHS Tayside | 29/04/2019 |
| Northumberland, Tyne and Wear NHS Foundation Trust | 03/10/2018 |
| North Devon Healthcare NHS Trust | 03/10/2018 |
| North Tees and Hartlepool NHS Foundation Trust | 03/10/2018 |
| Nottingham University Hospitals NHS Trust | 03/10/2018 |
| Portsmouth Hospitals NHS Trust | 03/10/2018 |
| University Hospitals Plymouth NHS Trust | 03/10/2018 |
| Rotherham, Doncaster and South Humber NHS Foundation Trust | 03/10/2018 |
| Royal Surrey County Hospital NHS Foundation Trust | 03/10/2018 |
| Royal United Hospital Bath NHS Trust | 03/10/2018 |
| Salford Royal NHS Foundation Trust | 29/04/2019 |
| Solent NHS Trust | 03/10/2018 |
| Somerset Partnership NHS Foundation Trust | 03/10/2018 |
| South Staffordshire and Shropshire Healthcare NHS Foundation Trust | 03/10/2018 |
| Southern Health NHS Foundation Trust | 03/10/2018 |
| Surrey and Borders Parnership NHS Foundation Trust | 03/10/2018 |
| Sussex Partnership NHS Foundation Trust | 03/10/2018 |
| Tameside Hospital NHS Foundation Trust | 29/04/2019 |
| Tees, Esk and Wear Valleys NHS Foundation Trust | 29/04/2019 |
| Worcestershire Acute Hospitals NHS Trust | 30/08/2016 |
Ethical considerations
This study uses aggregated, trust-wide data. The details of all trusts discussed have been anonymised throughout this research, except, in the case of the named roster policies, which are (or have previously been) freely available online. No data regarding any individual hospital, unit or staff member were used in this research.
Data analysis
Analysing unavailability data from the e-rostering system
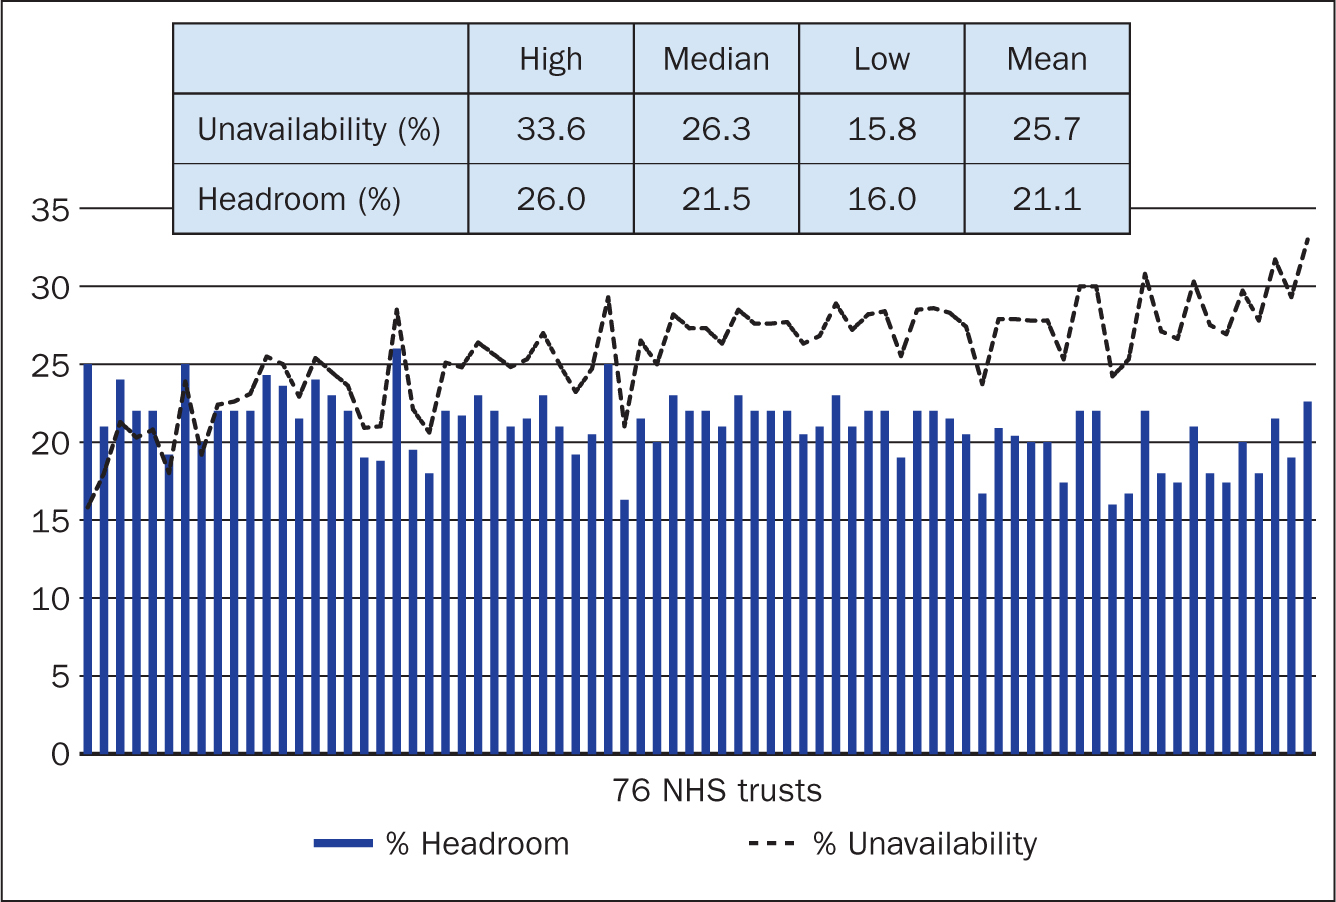
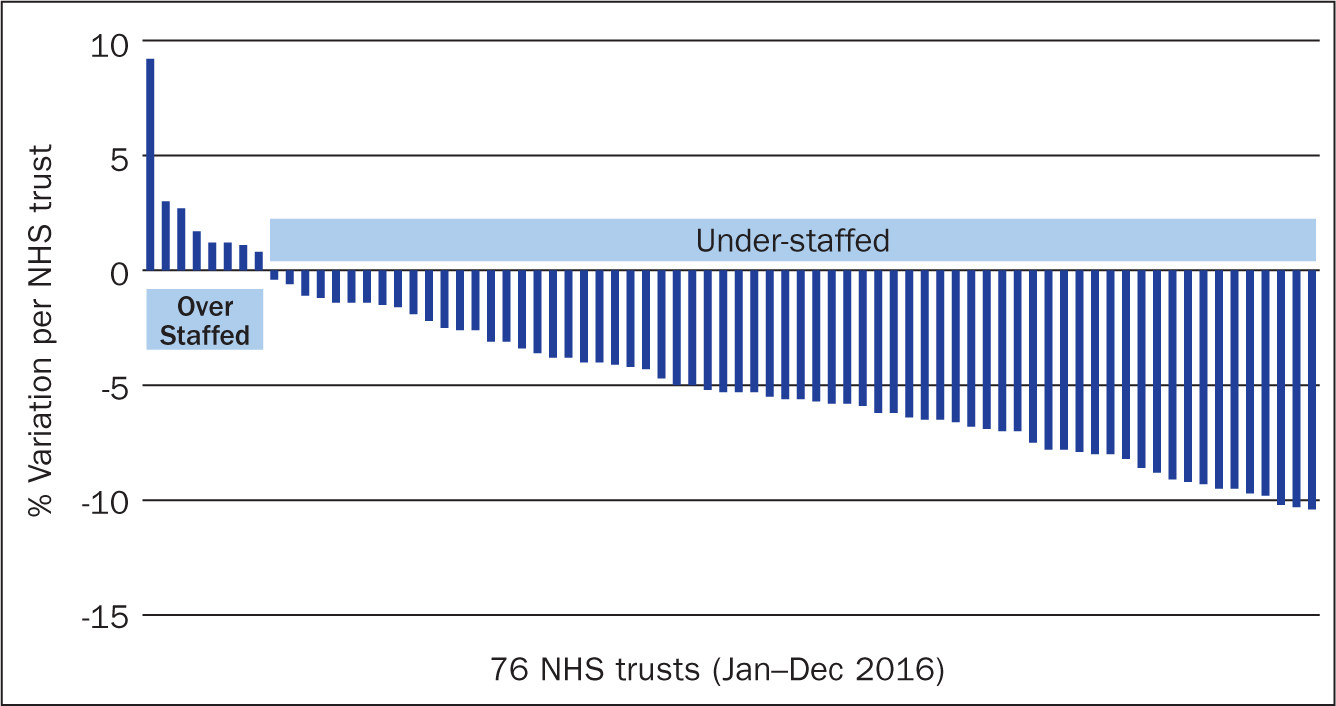
For the 87 trusts examined, the maximum, minimum, mean and median recorded variability were documented (Figure 1). However, 11 of these trusts did not include data for headroom. These 11 were then removed from the sample and for each remaining trust, the values of planned headroom were compared with those for recorded unavailability occurring over a 12-month period (Figure 2). Finally, for each trust, actual unavailability was subtracted from headroom to provide an estimate of the potential for over- or under-staffing (Figure 3).
Analysing headroom data from roster policies
Of 35 policies citing headroom, 13 did not specify any value for headroom or any of its components. Of the remaining 22 roster policies, those of two trusts, Isle of Wight and Royal United Hospital Bath, included headroom figures of 22% but did not specify the components of this total. Where available, the value of each component of headroom, as specified within the roster policy, was recorded (Table 3).
| Trust | Headroom (%) | Annual leave (%) | Sickness (%) | Study leave (%) | Parenting (%) | Working day (%) |
|---|---|---|---|---|---|---|
| South Staffordshire and Shropshire Healthcare NHS Foundation Trust | 25.0 | 15.8 | 3.9 | 3.4 | 0.0 | 2.0 |
| Cheshire and Wirral Partnership NHS Foundation Trust | 25.0 | 14.0 | 4.0 | 4.0 | 0.0 | 3.0 |
| Hampshire Community Health Care | 24.0 | 14.0 | 3.0 | 2.0 | 3.0 | 2.0 |
| Rotherham, Doncaster and South Humber NHS Foundation Trust | 24.0 | 15.0 | 4.0 | 3.0 | 0.0 | 2.0 |
| Solent NHS Trust | 24.0 | 15.0 | 4..0 | 2.0 | 2.0 | 1.0 |
| Sussex Partnership NHS Foundation Trust | 24.0 | 15.0 | 3.5 | 5.5 | 0.0 | 0.0 |
| Southern Health NHS Foundation Trust | 23.0 | 14.0 | 3.0 | 2.0 | 3.0 | 1.0 |
| University Hospitals Plymouth NHS Trust | 22.5 | 15.0 | 4.0 | 1.0 | 2.5 | 0.0 |
| NHS Tayside | 22.5 | 15.0 | 4.0 | 2.0 | 1.5 | 0.0 |
| Aintree University Hospital NHS Foundation Trust | 22.0 | 15.5 | 4.5 | 2.0 | 0.0 | 0.0 |
| Somerset Partnership NHS Foundation Trust | 22.0 | 16.0 | 4.0 | 2.0 | 0.0 | 0.0 |
| North Tees and Hartlepool NHS Foundation Trust | 21.5 | 14.0 | 4.0 | 3.5 | 0.0 | 0.0 |
| Leicestershire Partnership NHS Trust | 21.0 | 14.0 | 4.0 | 2.0 | 0.0 | 1.0 |
| NHS Borders | 21.0 | 15.0 | 4.0 | 0.0 | 2.0 | 0.0 |
| Nottingham University Hospitals NHS Trust | 21.0 | 13.5 | 4.0 | 3.5 | 0.0 | 0.0 |
| Surrey and Borders Partnership NHS Foundation Trust | 21.0 | 11.0 | 7.0 | 3.0 | 0.0 | 0.0 |
| Northumberland, Tyne and Wear NHS Foundation Trust | 21.0 | 14.0 | 5.0 | 2.0 | 0.0 | 0.0 |
| Doncaster and Bassetlaw Hospitals NHS Foundation Trust | 20.6 | 15.0 | 3.6 | 1.0 | 0.0 | 1.0 |
| Barnet, Enfield and Haringey Mental Health NHS Trust | 19.0 | 10.0 | 3.0 | 3.0 | 0.0 | 3.0 |
| Mersey Care NHS Foundation Trust | 18.0 | 15.0 | 3.0 | 0.0 | 0.0 | 0.0 |
| Mean: | 22.1 | 14.3 | 4.0 | 2.6 † | 2.3 † | 1.8 † |
Zero values excluded when calculating mean value.
Validity and reliability/rigour
Data collection took place at least 1 year after the implementation of the e-rostering system to allow unit staff to gain experience in using the system. Despite this, some staff were still learning the intricacies of the e-rostering system and, in some cases, target headroom data had not been entered. The roster policies used in this research were originally collected between 2015 and 2017 as part of a separate study. Where these policies have been updated, the most recent version has been used.
Results
Headroom and unavailability data from e-rostering system
Across the 87 trusts examined, recorded unavailability varied from 16% to 34% (Figure 1). Fourteen trusts were below the 22% headroom figure recommended by Hurst (2003) and the lower limit suggested by McIntyre (2016), while 54 were above the upper limit of 25% prescribed by McIntyre (2016). Consequently, the average across the sample, 25.7%, was higher than McIntyre's upper limit. Of the 76 trusts specifying headroom data, headroom varied from 16% to 26% (Figure 2), with an average of 21.1% (marginally lower than Hurst's recommendation and McIntyre's lower limit). For trusts where headroom exceeded unavailability (positive variability) there was the potential for over-staffing. For those where unavailability exceeded headroom (negative variability), this was indicative of under-staffing (Figure 3). The mean for both headroom and unavailability were calculated for the remaining 76 units.
Headroom in roster policies
Of 35 policies citing headroom, 13 did not specify any value for headroom or its components. For the remaining 22 policies, headroom varied from 18% to 25%, with an average of 22%. This corresponds to the recommendation of Hurst (2003) and the lower limit of the range recommended by McIntyre (2016). The roster policies of two trusts, Isle of Wight NHS Trust and Royal United Hospitals Bath NHS Foundation Trust, included headroom figures of 22% but did not specify the components of this total and were therefore excluded from further analysis. For the remaining 20 trusts, the value of each component of headroom, as specified within the roster policy, often varied substantially between trusts (Table 3). For example, annual leave, the largest component of headroom, was only 10% at Barnet, Enfield and Haringey Mental Health Trust, but 16% in the Somerset Partnership NHS Foundation Trust. The range of quoted headroom across the sample varied from 18% to 25% (Table 4).
| Range | |||
|---|---|---|---|
| Minimum value (%) | Maximum value (%) | ||
| From roster policies | |||
| % Headroom | 18.0 | 25.0 | |
| % Annual leave | 10.0 | 16.0 | |
| % Sickness | 3.0 | 7.0 | |
| % Study leave | 0.0 | 5.0 | |
| % Parenting | 0.0 | 3.0 | |
| % Working day | 0.0 | 3.0 | |
Discussion
Unavailability and headroom
In the UK, it has been suggested that a 1% improvement in staff unavailability would provide an additional £339 million to fund further frontline work (NHS Workforce Deployment Expert Group, 2018). To offset this unavailability, trusts are advised to include headroom when setting unit establishments (NHS Improvement, 2018) but, importantly, unavailability and headroom are not the same. At board level, many trusts regard headroom as a KPI and set targets for its components in their roster policies (Mersey Care NHS Foundation Trust, 2017). Often, this ‘headroom KPI’ is applied across all units (Mersey Care NHS Foundation Trust, 2017; North Tees and Hartlepool Hospitals NHS Foundation Trust, 2018). However, this research highlights large variations in unavailability from 15.8% to 33.6% (Figure 1) and contrasting levels of headroom (16-26%). Indeed, 13% of the Trusts investigated did not incorporate any headroom in their e-rostering system. These 11 trusts included the one with the highest recorded unavailability (33.6%) and five others that exceed McIntyre's (2016) 25% threshold.
Low values of unavailability (≤ 20%) may be regarded as unusual, given a mandated annual leave allowance between 13% and 16% (NHS Staff Council, 2019) and a typical sickness rate of 4.5% (NHS Digital, 2018). Such levels of unavailability may require further scrutiny to confirm that study leave, parenting and non-clinical work are included. In this research, seven trusts recorded unavailability of 20% or less in their e-rostering systems. In the roster policies examined, 18 trusts declared headroom below 20%. The roster policies of two trusts—Barnet, Enfield and Haringey Mental Health Trust and Mersey Care NHS Foundation Trust—provide a useful insight (Table 3). Barnet, Enfield and Haringey quotes a headroom of 19% based on 10% annual leave and 3% sickness. However, assuming staff plan to use all of their holiday entitlement, annual leave must be between 13% and 16%. To achieve 10% annual leave, even assuming all staff have less than 5 years' service, each employee would need to forego 9 days of holiday. Regarding sickness, the trust policy provides only a 3% allowance, this despite an average trust sickness rate of 4.2% for the 9-year period 2009–2018 (NHS Digital, 2018). Similarly, Mersey Care quotes a headroom of 18% based on 3% sickness and no allowance for study leave or non-clinical working. The average sickness rate for Mersey Care for the period 2009-2018 was 6.2%. Barnet, Enfield and Haringey and Mersey Care were 2 of 14 trusts that did not specify an allowance for parenting (Table 3) in their roster policies.
NHS Improvement (2018) offered a sample breakdown of headroom (Table 5) that has been used as the basis for some roster policies. However, it appears at odds with guidelines produced by other bodies such as the NHS Staff Council and the NMC. It also makes no allowance for non-clinical work. Clearly, budgeting for unavailability remains challenging and recommendations of headroom value have been omitted from the current Nursing and Midwifery E-rostering: A good practice guide (NHS England and NHS Improvement, 2019b). A further barrier to achieving more accurate headroom allowance may be the nature of certain components of unavailability.
| NHS Improvement figure | Comments | |
|---|---|---|
| Annual leave | 14.7% | 13–16% according to the service of employee (NHS Staff Council, 2019) |
| Sickness/absence | 3.0% | 4.48–4.83% for the last decade (NHS Digital, 2018) |
| Study/CPD leave | 3.0% | Minimum of 0.6% (Nursing and Midwifery Council, 2019) for mandatory training only |
| Parenting | 1.0% | 2% per child, excluding maternity/paternity leave (NHS Improvement, 2018) |
| Other leave | 0.5% | Includes carers' leave, compassionate leave, etc (NHS Improvement, 2018) |
| Non-clinical work | 0.0% | 20% ‘protected time’ for unit managers (Scottish Executive Health Department, 2004) |
| Total: | 22.2% |
Annual leave and sickness
Annual leave varies within the range 13-16% according to the service profile of each unit (NHS Staff Council, 2019) and analysis of roster policies (Table 3) supports this, with a mean of 14.3%. Given that leave must be requested, and often requires a notice period, the challenge for unit managers is ensuring that leave is taken regularly throughout the year—a difficult, but manageable, task in most instances. In contrast, absence due to ‘sickness’ often occurs without notice and is difficult to forecast. Such short-term absence may be due to social and personal factors rather than illness, whereas long-term absence is mostly associated with medical problems (Johnson et al, 2003).
At trust level, given the smoothing effect of multiple units and the annualisation of data, variations of sickness absenteeism appear modest and consistent with those typically quoted in roster policies. However, at unit level, the situation is quite different. For example, trust-wide sickness data from North Staffordshire Combined Healthcare NHS Trust for the period 2009–2018 revealed an average sickness level of 4.6% (NHS Digital, 2018). However, using data from the trust's Six Month Safer Staffing Reviews (Wilson, 2014; Sylvester, 2015; North Staffordshire Combined Healthcare NHS Trust, 2016; 2017), it is clear that, at unit level, absenteeism due to sickness fluctuates significantly (Table 6). Furthermore, taking longitudinal data for each unit, it is clear that some units have prolonged issues with high levels of sickness. In this instance, a trust-assigned allowance of 4.6% for unavailability due to sickness would give insufficient headroom to meet the requirements of, say, the Summers View unit, which had an average sickness rate of 10.7% for the period October 2013 to June 2016 (Table 6). Consequently, to ensure safe staffing, it is important that the setting of trust targets for sickness unavailability is not confused with realistic unit-based values when determining headroom.
| Unit | Oct 2013-Mar 2014 | Jan-Jun 2015 | July-Dec 2015 | Jan-Jun 2016 | Max | Min | Diff. | Mean |
|---|---|---|---|---|---|---|---|---|
| Ward 1 | 5.1% | 8.1% | 8.2% | 2.1% | 8.2% | 2.1% | 6.1% | 5.9% |
| Ward 2 | 3.1% | 9.0% | 11.6% | 10.6% | 11.6% | 3.1% | 8.5% | 8.6% |
| Ward 3 | 6.3% | 8.4% | 9.1% | 4.6% | 9.1% | 4.6% | 4.5% | 7.1% |
| Ward 5 | 6.1% | 4.7% | 8.2% | 6.3% | 8.2% | 4.7% | 3.5% | 6.3% |
| Ward 6 | 7.2% | 8.4% | 9.5% | 6.5% | 9.5% | 6.5% | 3.0% | 7.9% |
| Ward 7 | 5.0% | 5.6% | 3.2% | 1.8% | 5.6% | 1.8% | 3.8% | 3.9% |
| Florence House | 9.1% | 7.2% | 5.1% | 10.2% | 10.2% | 5.1% | 5.1% | 7.9% |
| Summers View | 8.9% | 9.3% | 10.9% | 13.8% | 13.8% | 8.9% | 4.9% | 10.7% |
| Darwin Centre | 2.3% | 2.0% | 2.1% | 3.2% | 3.2% | 2.0% | 1.2% | 2.4% |
| Assess and Treatment (A&T) | 6.0% | 6.6% | 4.4% | 12.1% | 12.1% | 4.4% | 7.7% | 7.3% |
| Edward Myers | 4.5% | 5.7% | 2.0% | 7.6% | 7.6% | 2.0% | 5.6% | 5.0% |
| Trust-wide data | 4.7% | 4.5% | 4.5% | 5.0% | 5.0% | 4.5% | 0.6% | 4.7% |
Continuing professional development (CPD) and study leave
Given that all nurses and midwives must complete 35 hours of mandatory CPD over a 3-year period (NMC, 2019), it would be prudent for roster policies to include a minimum of 0.6% study leave unavailability. Details from the 20 roster policies examined shows a broad spread, including two policies with no allowance for study leave. NHS Improvement (2018) recommends a study leave allowance of 3%, which compares favourably with the 2.3% average value from the roster policies examined. Ultimately, CPD/study leave should be determined by each individual's personal development plan (PDP) and agreed within the staff appraisal process, putting study leave within the purview of the unit manager.
Parental leave allowance
The NHS Staff Council (2019) noted that parental leave is a separate provision from maternity/paternity leave and provides an employee the right to at least 18 weeks' leave if caring for a child under the age of 18 years. This is contrary to McIntyre (2016) and the NHS Improvement (2018), who suggest that maternity leave is included in parental leave allowance. Furthermore, only six trusts include parental leave as a component of headroom in their roster policies. Moreover, there is some confusion regarding inclusion of maternity/paternity leave in parenting leave. The NHS Staff Council (2019) has clearly stated that ‘Parental Leave is a separate provision from either maternity or maternity support (paternity) or adoption leave’, while McIntyre (2016) and NHS Improvement (2018) have suggested that it be included in ‘parenting’. The Safer Nursing Care Tool (Shelford Group, 2013) specifies a headroom of 22% but this does not include maternity leave—which, as Hinchliffe (2013: 21) noted, ‘can be compromising when more than 50% of Leeds Teaching Hospitals Trust wards have a maternity leave rate of greater than 3%.’ Four of the roster policies that incorporated a parenting allowance included maternity/paternity leave.
Non-clinical work
Only nine of the policies reviewed included an allowance for non-clinical days, with an average allowance of 1.8%. This is surprising given the management, administration and reporting responsibilities of unit managers (Wise, 2007). Clearly, for care targets to be met, more research is required to assign an appropriate degree of non-clinical time to the headroom allowance.
Conclusion
The transparency offered by e-rostering has shone a light on the use and composition of headroom, allowing it to be administered as a KPI. Consequently, trusts are encouraged to define headroom around idealised ‘target’ values, often to the detriment of headroom as a fundamental component of unit establishment. In order for a unit to be safely staffed, its headroom must reflect the anticipated unavailability on the unit as accurately as possible—it must be realistic. Unavailability varies from individual to individual, depending on length of service, managerial responsibilities, career development and personal circumstances, such as sickness, number of children etc. Consequently, to ensure establishment is sufficient to meet the demand template, headroom will also vary from unit to unit, given each unit's unique staff profile. Thus, specifying performance, based on a single trust-wide metric, may prove grossly misleading. Compelling a unit with unavailability of between 28% and 30% to adopt a trust-wide headroom of 22% may, at best, increase spending on bank/agency staff, or, at worst, jeopardise patient safety. One alternative would be to build headroom from the bottom up by creating (and maintaining) individual ‘headroom profiles’ for each member of staff. This would provide an accurate estimate of headroom and identify issues at an individual and unit level. Some components of unavailability, such as annual leave and study leave, can be planned and managed within the unit. Others, such as sickness and parenting, are much less predictable. Some trusts allow annual leave and study leave to be managed by the unit, while managing sickness and parenting centrally based on unit needs.
Ultimately, the concept of headroom is failing. Its value as a KPI is undermined by inconsistent allocation (or omission) of its components and the implication that a single, trust-wide, value can be used to aggregate a unique series of staff profiles. However, more dangerous, is the fallacy that headroom can be strictly ‘managed’ within an arbitrary target. For safe staffing and better patient outcomes, headroom data must always be accurate and, of course, realistic.